Project
Calculating Reaction Energy Barrier of HCN Formation From CH20 With CUSSZ13 Zeolite Catalyst
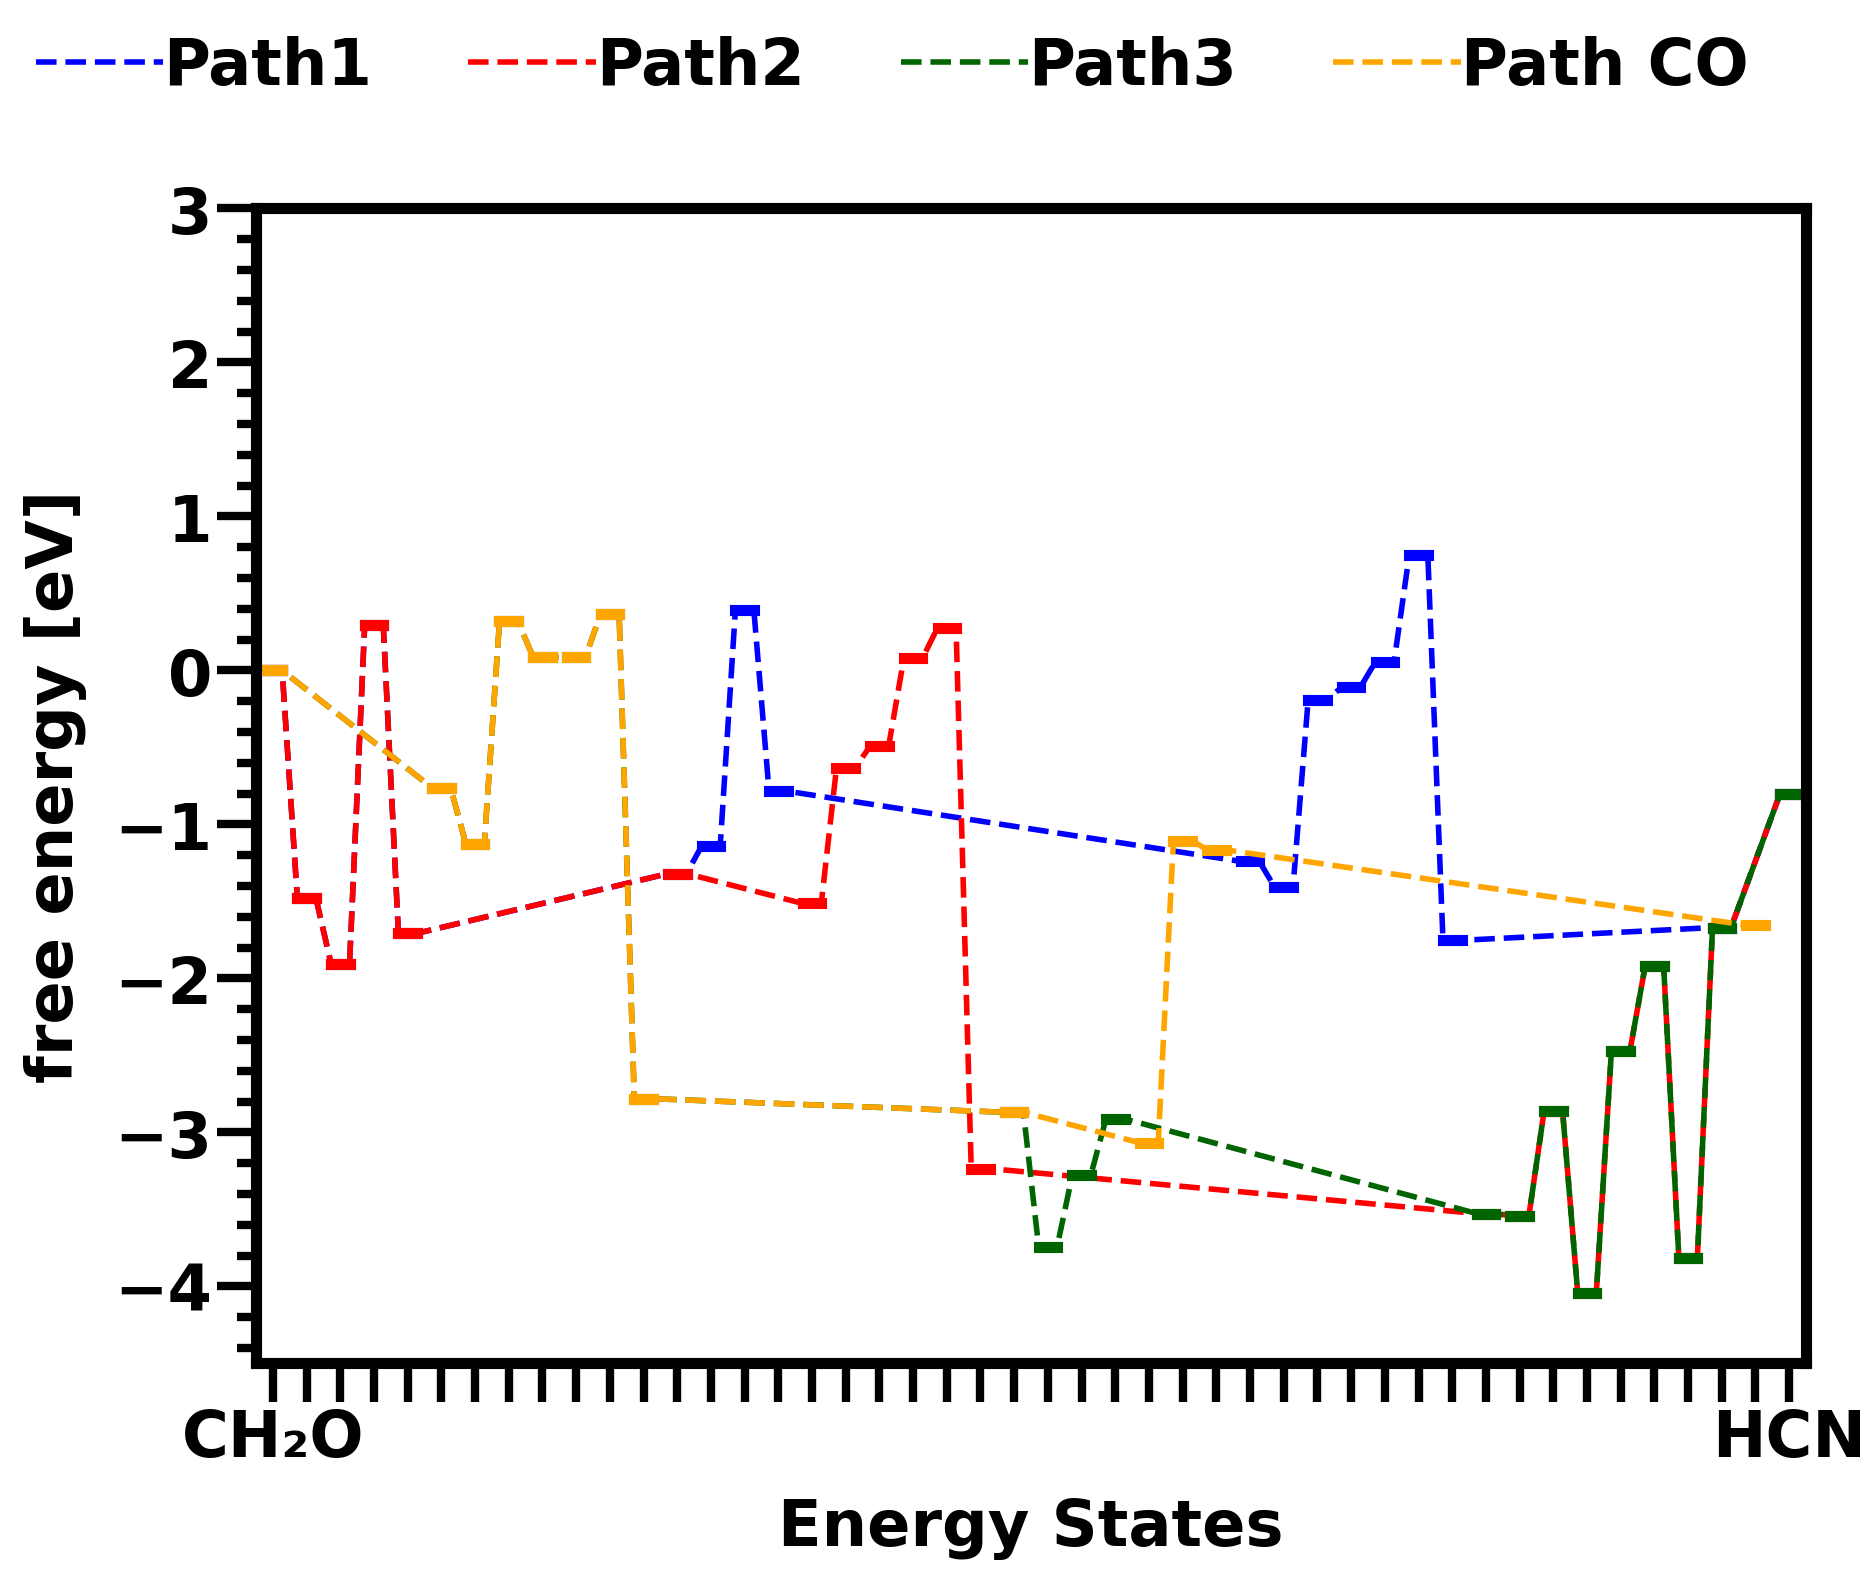 Figure 1: Free energy diagram of formaldehyde to HCN pathways (path1,2,3) and CO pathway on Cu sites of Cu-SSZ-13 zeolite catalyst.
 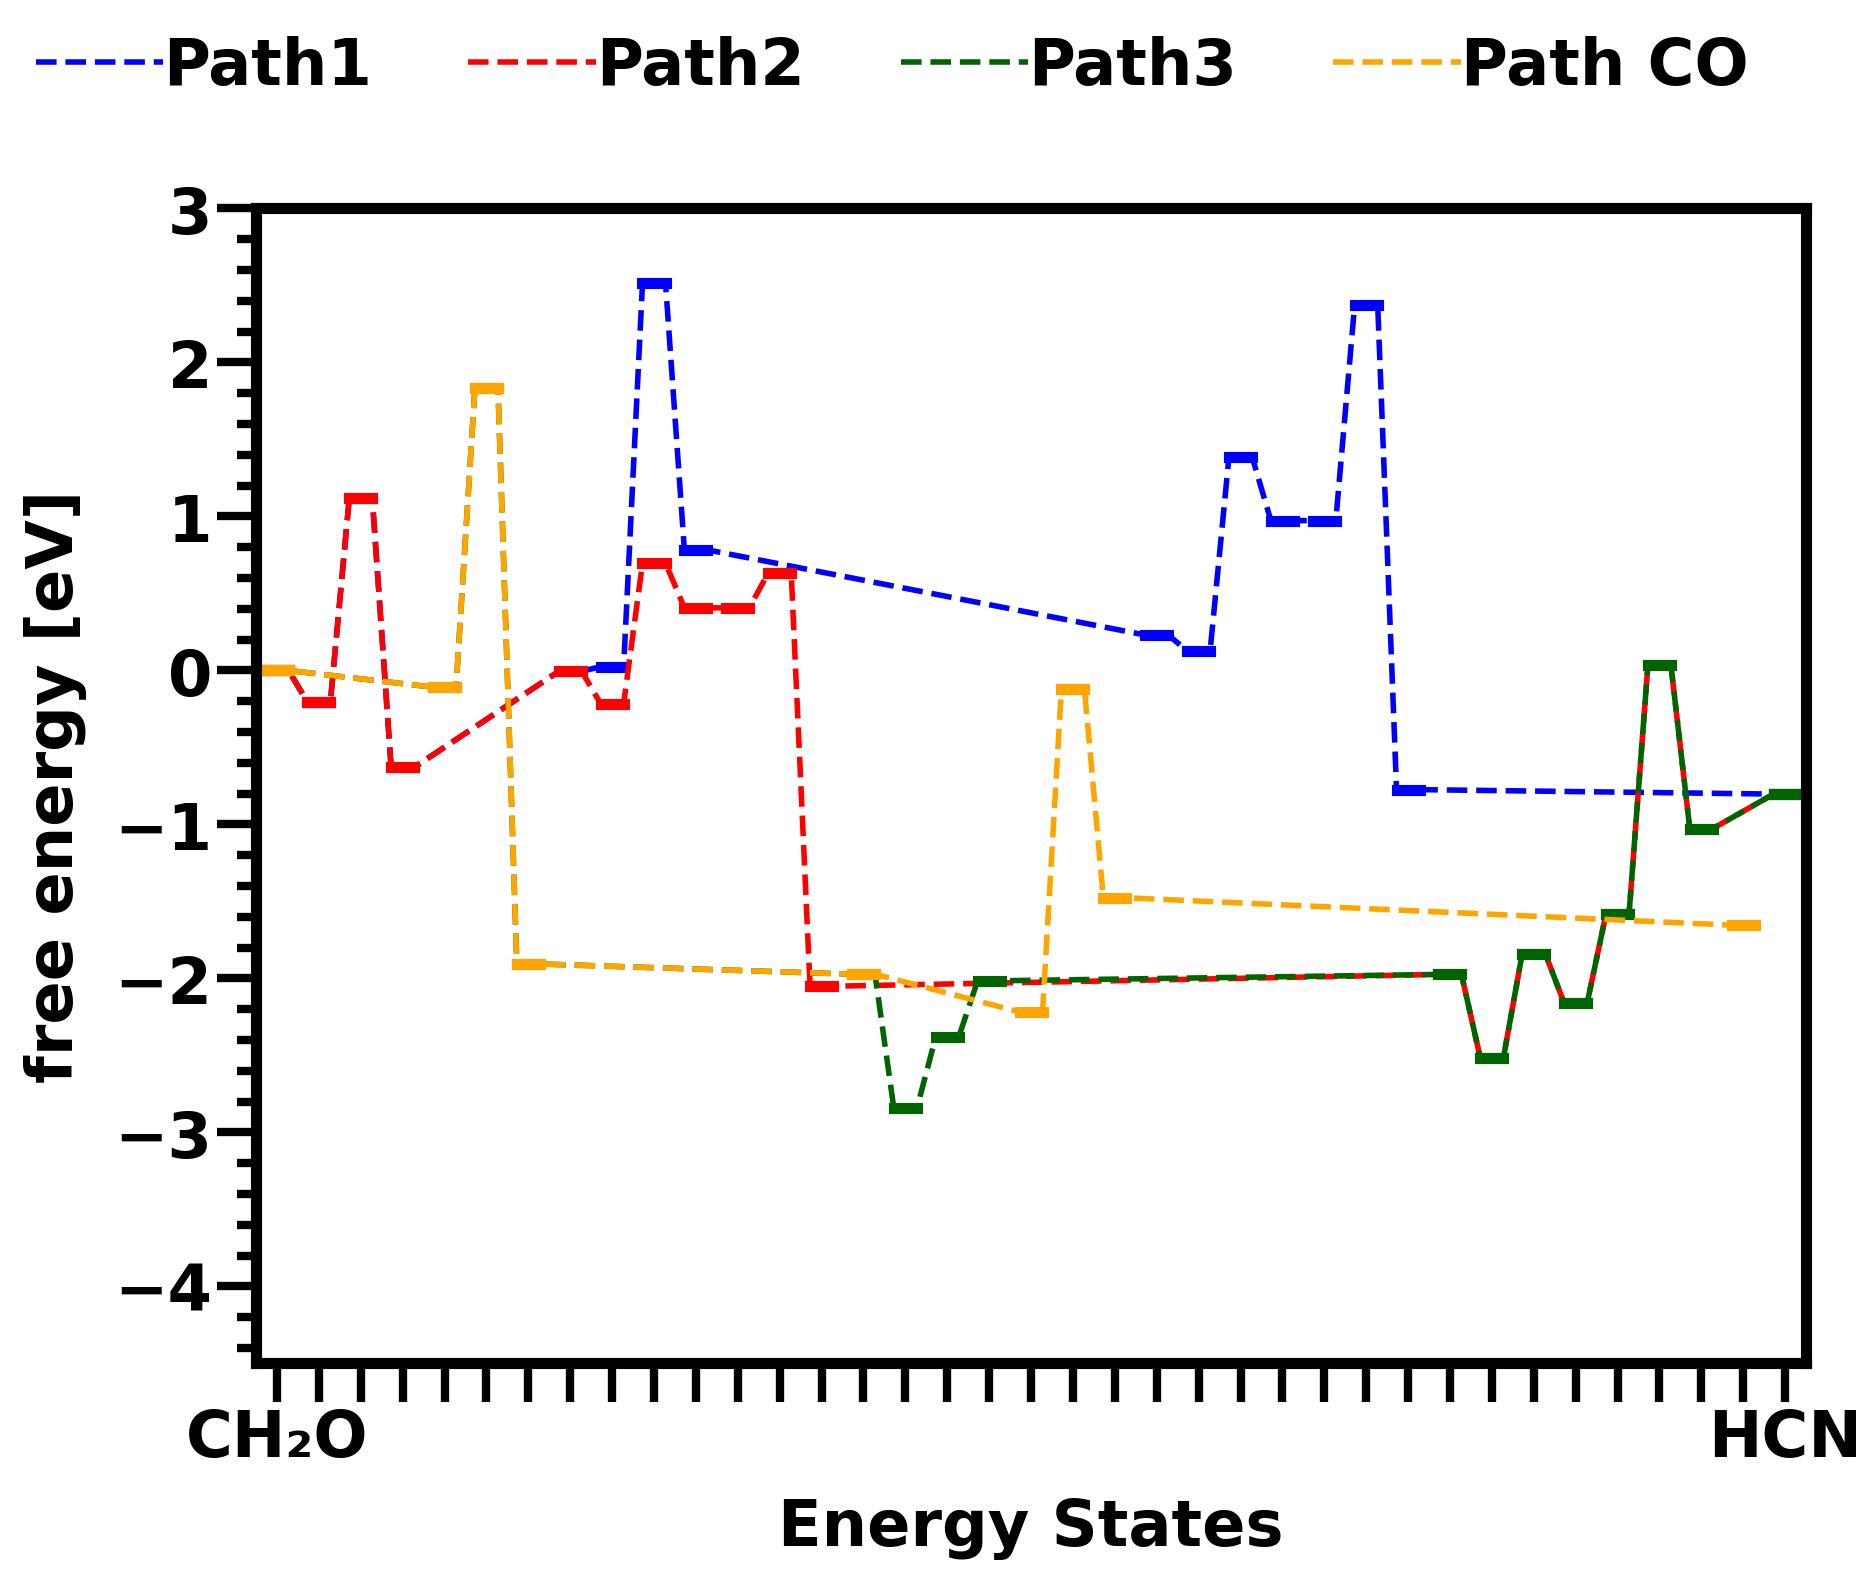 Figure 2: Free energy diagram of formaldehyde to HCN pathways (path1,2,3) and CO pathway in gas phase.
 Biomass-derived fuels are promising candidates to replace traditional fossil-based fuels for mobility and propulsion but their usage leads to emission of unconventional and harmful species which must be after-treated. Selective catalytic reduction (SCR) is a standard technology to reduce NOx emissions. NH3 -assisted SCR of NOx with NH3 has been studied on many zeolite surfaces, such as Cu- and Fe-doped zeolites. In exhaustgas emissions that contain formaldehyde (CH2O), hydrogencyanide (HCN) formation takes place during NH3 -SCR, which is a very hazardous chemical. Possible pathways of HCN formation from CH2O have been studied and its gas phase reaction barrier has been calculated. But till now, there is no research on the catalysed HCN formation with Cu-SSZ-13 zeolite catalyst, which has been recently observed in experiments. Knowing the reaction energy barrier of different pathways will be helpful in understand which reaction path is preferred and if the catalyst is playing a role in HCN formation.
The catalyst model we consider is complex and calculation of energy barrier requires much computing time. In addition, we are considering three different HCN formation pathways with different intermediates. This means we have to finish many jobs. As preliminary work, we did some calculations with software ORCA, which is optimized for parallel calculation, and we were facing the convergence problem and some of the jobs even exceeded the memory limit. We didn’t have enough computing time to solve the problems, so we applied for the prob project of TUDA cluster.
Project Details
Project term
November 1, 2023–April 30, 2024
Affiliations
RWTH Aachen University
Institute
Multi-scale Modeling of Heterogenous Catalysis in Energy Systems
Project Manager
Principal Investigator
Methods
To find the reaction energy barriers, software ORCA was used for nudged elastic band (NEB) calculations. NEB calculations will split the reaction path into many images and optimize them to find the minimum energy path (MEP). The saddle point of the MEP is the energy barrier of the reaction.
Before starting the NEB calculation, the geometries are first optimized to create the endpoint images, namely the first and last images of the reaction path.
The catalyst model applied is a relevantly large system (106 atoms of framework plus gas phase or adsorbed species). Although 60 out of 106 of the framework atoms were fixed, the large degree of flexibility still made the NEB jobs difficult to converge. To solve the convergence problem, the free-end NEB and zoom NEB methods were applied. Instead of fixing the endpoint images, free-end NEB optimizes them along with the intermediates. Zoom NEB will first roughly converge the path to MEP, then insert more images around the maximum energy image and finish the calculation with this new path. Both methods were trying to obtain better resolution of images around the saddle point of the reaction path for better convergence. The combination of the methods, namely free-end zoom NEB solved most of our convergence problems.
With the optimization and NEB calculations mentioned above, we were able to finish the energy barrier calculations for three HCN formation pathways considering both in gas phase and on catalyst Cu site. This includes at least 16 NEB and 32 optimization calculations. Most optimization jobs can converge within 24 hours using 48 processors, but most NEB jobs couldn’t finish within 48 hours using 96 processors. With free-end NEB and zoom NEB methods and by restarting, all the jobs are finally converged but this consumed at least 4 times the computing hours. In total, not considering the jobs that failed or the test runs, at least 48 NEB jobs are submitted using 96 processors and 48 hours wall-time limit.
We also tried all the optimizations with setup that can provide better accuracy (better basis set of calculations) but we gave up because the optimizations took already more than 200 GB memory, and NEB jobs will take much more memory.
Results
Attached pictures shows energy diagrams for reactions in gas phase and on catalyst surface Cu sites. Both pictures show the energy states change in three different HCN formation pathways and one CO formation pathway from CH2O. Comparison between the two pictures shows that the overall energy barrier of all pathways are lower down by surface reactions.
Discussion
Reaction energy barriers of different HCN formation pathways from CH2O are calculated both in gas phase and on catalyst Cu sites. Further analysis is required to tell whether the reaction is catalyzed on the Cu site and which HCN formation pathway is dominant. With the prob project, we didn’t have enough computing time to explain what’s the role of NO2 in reducing HCN emission, which was found in experiments. This could be the next step for our research.
During our trial with the prob project, we noticed one problem: When running optimization jobs with ORCA on TUDA cluster, almost half of the jobs were running quite slow (almost 10 times slower). The same jobs were also submitted on the RWTH cluster to test the speed and all jobs were able to run smoothly there. Some jobs were slow when submitted the first time on TUDA cluster but will have the normal speed when resubmitted. We guessed that some nodes on TUDA cluster are either slow or not cooperating with software ORCA very well.
Additional Project Information
DFG classification: 403-01 Chemical and Thermal Process Engineering
Software: VASP, ORCA
Cluster: Lichtenberg
Publications
Tang, S; Schönberger, A.; Khetan, A. Theoretical Study and Simulation of Kinetics in NH3- Selective Catalytic Reduction in Zeolite Monoliths, 12th International Conference. Fuel Science: From Production to Propulsion. Aachen, Germany, June 11 to 13 (2024)